Can you check if my computer’s been hacked?
If you’re looking to get into the DFIR field, or you’ve just started, there will be a point in your career when you get asked one of the following:
- ‘My computer is acting weirdly, can you see if it’s been hacked?’
- ‘This employee is complaining that their computer is slow, please check if there’s been any malicious activity’
- Insert random family member who believes you’re an IT god/goddess.
The problem with these types of cases is that there’s no lead to start investigating on. Before I jump into some technical guidance on where to begin looking, it might be prudent to ask the following questions to the client:
- How long has the user been experiencing these issues for? This will help to give you an indication of the timeframe you should be investigating; was it yesterday, a week ago, or a month ago? Use this to filter timestamps, event logs, your SIEM etc.
- What issues has the user been experiencing? Does this happen on a regular basis?
- What is the users role in the organisation? If the answer is sales, HR, finance, or the C-suite, just go straight to their emails to see if they’ve been phished; don’t hold me to this, but majority of the time, this would have been the initial source of infection.
The following technical section has been written to provide brief direction on what to start examining, and this is for two reasons: each circumstance is different. You will likely never have two DFIR cases with the exact same TTP’s (tactics, techniques, and procedures). Secondly, I could write a book on each artefact to look at, as they could all be affected by threat actor activity; but that’s not what the intention of this post is. 🙂
Event Logs
There are numerous articles online regarding event logs, but I wanted to fine tune this by looking at specific activities run by a user that you can filter on (handy if you have Splunk or a SIEM, but achievable using Windows Event Viewer too), and perhaps a few things that overlooked too.
Firstly, the logs’ location: C:\Windows\System32\winevt\logs
Some basic log events found in Security.evtx include:
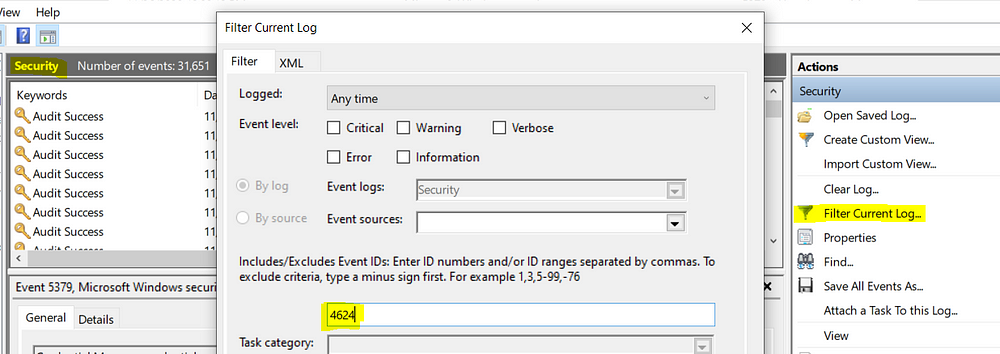
- 4624/4634 — successful logon and logoff; there’s a field here called LogonID which you can use to track how long an attacker was logged on for. You see what process was used, logon type, and if you’re lucky, the workstation name and IP address from where they initiated the logon. You can filter for these using the native Event Viewer, as shown below:
- 4672 — an account logon with superuser rights; they’ve got admin rights. If they used explicit credentials, the logon EID would be 4648.
- 4720 — an account was created; it’s not uncommon for attackers to do this to maintain persistence
- 4625 — failed logon attempt; if you see multiples of these one after the other, someone’s trying to brute force their way in
- 1102 (Security), 104 (System) — audit log was cleared; attackers small and large do this to cover their tracks.
Another gold mine is OAlerts.evtx, which, if enabled, will log whenever a user opens a Microsoft Office file. More to the point, I’m sure you’ve seen those pop up’s whenever you go to enable macros. Those are logged too, along with the file name of the document that was opened. This is the perfect way to determine whether the client was phished.
For instance, we can see below that a Microsoft Word document attempted to run code, specifically, a SQL command. Whilst this example isn’t malicious, you can imagine how useful it would be during a phishing campaign.

Internet History
A quick way to find out whether a user has downloaded malware or has opened a phishing email, is to analyse their visited websites and what files were downloaded from the Internet. As Google Chrome is the most widely used browser, I’ll do a deeper dive into its forensic artefacts.
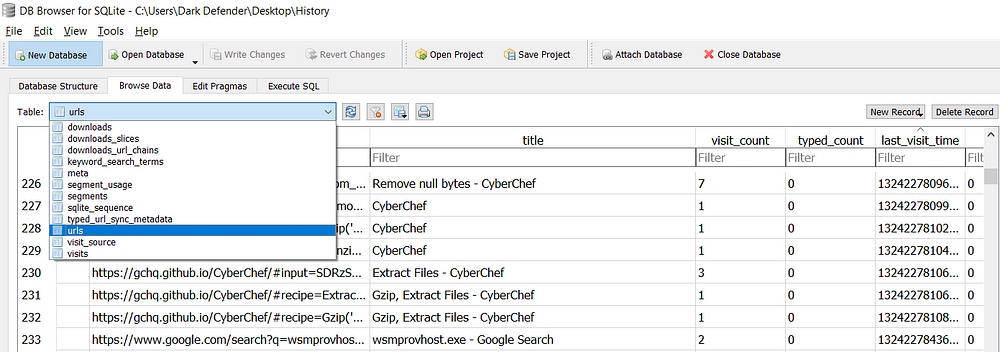
Google Chrome: the ‘History’ file is where you will find all visited sites and downloads; C:\Users\username\AppData\Local\Google\Chrome\User Data\Default\History. Google stores this, and other files such as ‘Bookmarks’, ‘Cookies’ etc., as SQLite Database files. To open these files, I recommend using DB Browser for SQLite (free to download).
In the screenshot below, you can see there are a number of tables in this database. I’d recommend looking into:
- downloads; in addition to the site the file was downloaded from or referred from, it will give you the start time of the download, and where on the users computer it was downloaded to (target_path)
- urls; don’t overlook the ‘title’ field, as this will show you interesting activity such as the subject line of an email or emails they’ve searched for
- keyword_search_terms; exactly what it sounds like.
Google stores timestamps in the number of microseconds since Jan 1 1601 UTC. That’s not important, what is though, is how to translate this to something you and I can understand. Here’s a command you can run using the same tool in the ‘Execute SQL’ tab.
I’m converting the timestamp, and asking the program to output the title and url of the web page visit, ordering it by the most recent user activity first. You can see that the table produced is much easier to read, and gives you a snapshot to be able to analyse efficiently for quick wins.
If you wanted to only focus on a specific timeframe, you can use an SQL command such as WHERE lastVisit_time BETWEEN “2020–11–01” AND “2020–11–26”.

Mozilla Firefox
Mozilla is much the same forensically speaking as Google Chrome. The directory to look into is C:\Users\username\Application Data
\Mozilla\Firefox\Profiles, which has a file called places.sqlite. As the extension suggests, this is the same type of file as the History file for Google Chrome. Places stores the users web history, bookmarks, and downloads. Use the DB Browser for SQLite tool to analyse this traffic.
Internet Explorer
You can find the history cache in: C:\Users\username\AppData\Local
\Microsoft\Windows\WebCache\WebCacheV01.dat. The file is an ESE Database, which I generally open using OSForensics or ESEDatabaseView. As you can see in the screenshot below, the database stores its files in directories.
Scheduled Tasks
Really quickly, scheduled tasks are created so that programs can run specific events at a specific time. They’re stored in C:\Windows\System32\Tasks.
In the security event logs, you’ll be looking for EID 4698 (Scheduled Task created). Attackers use this quite often as scheduled tasks aren’t routinely checked; additionally, attackers use scheduled tasks to run obfuscated code, so be cautious of anything encoded in base64.
Persistence Mechanisms
Sometimes a user will say ‘I restarted my computer and still have the same problem’. Well, there’s an easy way to check if this is actually happening. A persistence mechanism is setup by an attacker, so that even when the user restarts their machine, the attacker still keeps their access.
The first place to investigate is the following Registry hive and keys:
- C:\Windows\System32\config\SOFTWARE
- The keys: SOFTWARE\Microsoft\Windows\CurrentVersion\Run & SOFTWARE\Microsoft\Windows\CurrentVersion\RunOnce
Any programs within these keys will execute on boot. RunOnce will run on boot and then delete the program from the list. I use Registry Explorer for this as it provides an easy to use graphical interface. It will also show you any deleted keys — super important if the attacker felt a little cheeky that day and deleted this persistence mechanism because they completed their objective and wanted to clean up.
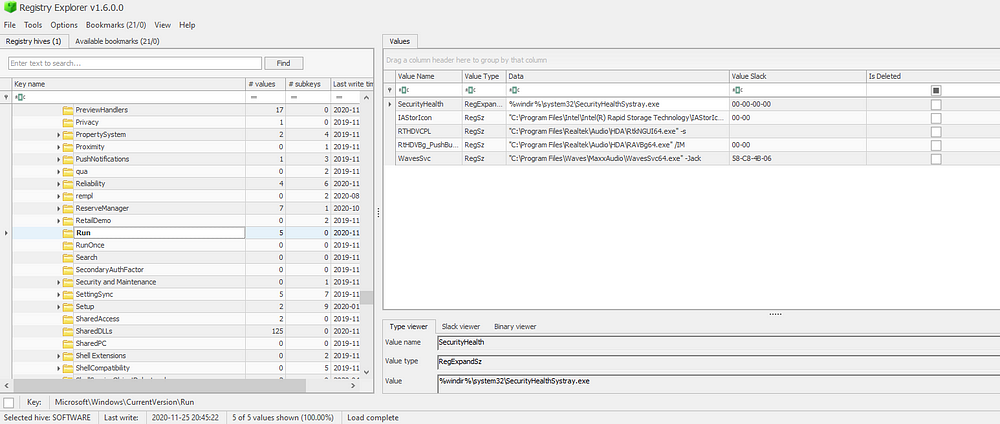
In the same ‘SOFTWARE’ registry hive, check the values for:
- Microsoft\Windows NT\CurrentVersion\Winlogon\Userinit. The value data should be C:\Windows\system32\userinit.exe, but attackers can easily manipulate this to point to their own malware, so that when the user logs in, the malware will also execute.
- Similarly, in the same Winlogon key, the value Shell should simply have ‘explorer.exe’ in its data field.
- Any programs listed in a users Startup Menu will automatically run when the user logs on; SOFTWARE\Microsoft\Windows\CurrentVersion
\Explorer\User Shell Folders; check this registry key, as it’s frequently misused by attackers.
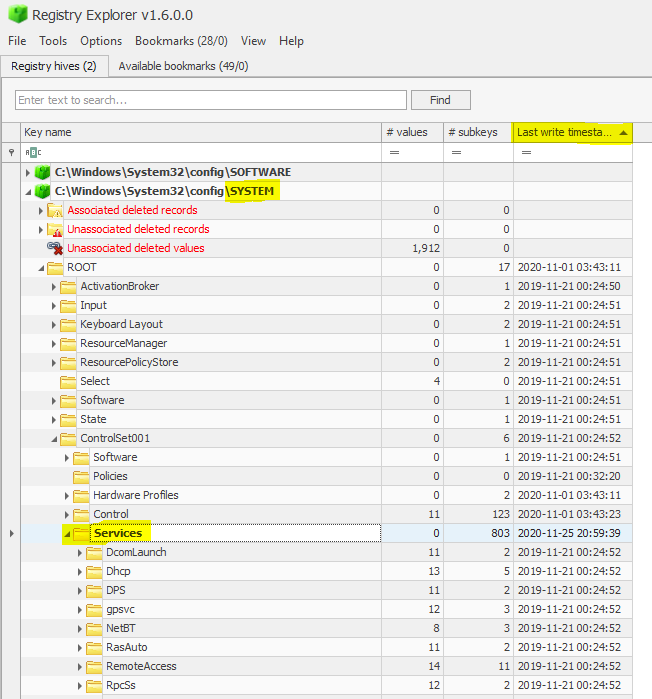
In the ‘SYSTEM’ registry hive, the key CurrentControlSet
/Services are all the the installed services on a machine. Attackers use this persistence mechanism as not many uses or administrators track what services have been installed.
The registry provides a long list, so I recommend sorting by last write timestamp (descending). This might get tedious though, so I recommend looking at the security event log for EID 4697, “a service was installed in the system”. You can also determine this in the system event log by looking for EID 7045.
Recently Open Files
We covered OAlerts, but this of course only covers Microsoft suite programs that were recently ran. What about executables or programs? Generally when a phishing email is successful, you’ll typically see email -> document -> web link or macro -> powershell -> cmd (command line execution).
Each user on a laptop will have their own ‘NTUSER.DAT’ file, which is their own personal history of activity. It’s a hidden and locked file in C:\Users\username\, which means you will need a tool like Registry Explorer to be able to read and analyse it.
The first step is going to NTUSER.DAT\Software\Microsoft\Windows
\CurrentVersion\Explorer\RunMRU. MRU, or Most Recently Used, will display the most recently used programs. The MRUList will give you the chronological order of program execution, so in this instance, the value ‘g’ was the most recently run program, or ‘D:\’ , followed by cmd in ‘a’.

My absolute favourite artefact though is RecentDocs (excuse the huge screenshot, I was worried it’d be blurry!).
In NTUSER.DAT\Software\Microsoft\Windows\CurrentVersion
\Explorer \RecentDocs, any file extension that you open on your laptop will be captured here in the same MRUList as we saw in RunMRU. It’s a sure-fire way of determining what was opened — super important in the case of phishing campaigns or potentially unwanted program downloads as they usually name malware something stupid like dog.pdf.bat.
You can see in the ‘Type Viewer’ section the filename written out in ASCII code, here with the file ‘PECmd.zip’. Whilst it doesn’t show you the file path, it’s a good lead to investigating other artefacts to try find this filename; an example would be .lnk files in C:\Users\username\AppData\Roaming\Microsoft\Windows\Recent.

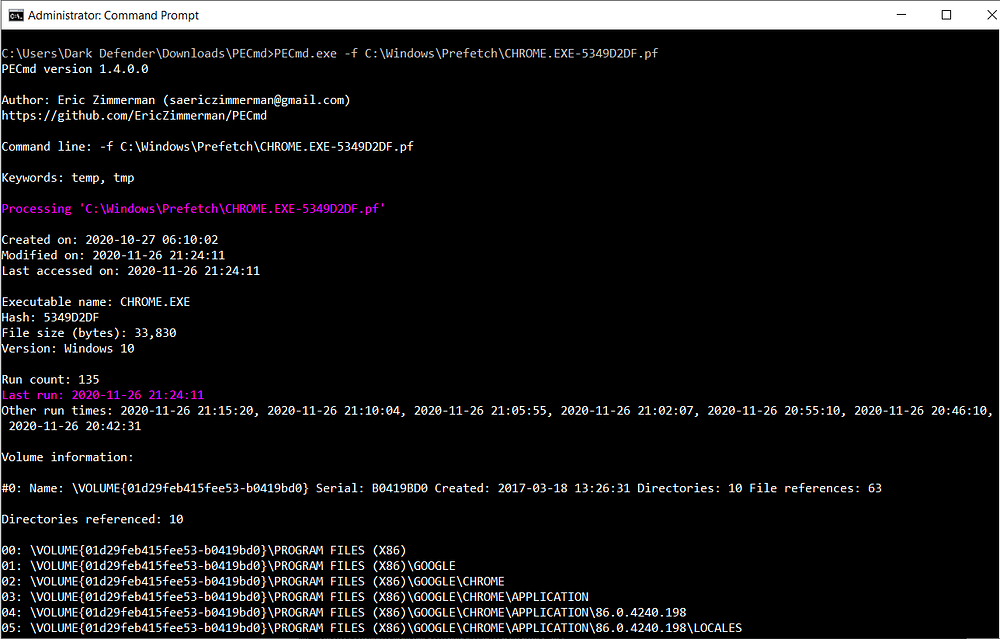
If those artefacts don’t show anything malicious, I’ve got one final evidence of execution to present: Prefetch. These files are stored in C:\Windows\Prefetch as .pf files. Whenever a program is executed, it will create a .pf file for it which stores:
- Name and full path of the executable
- The first and last time it executed, the number of times it has been executed, and the files/handles that were used by the program at the time of execution
- The last 8 timestamps of when it was executed.
Pretty full on right? To parse and analyse these files, I use Eric Zimmerman’s PECmd. Along with the details mentioned above, it also tags any malicious files or handles the program referenced in red.
Something to note: you may see multiple prefetch files for the same program. This is because prefetch files are created for each different path that the program was executed from. So, if I ran Google Chrome from my Desktop and the Downloads folder, I’ll have two prefetch files. This is why we see a hash-like value after ‘CHROME.EXE-’ below.
That would have been a lot to take in if you didn’t know much about Windows forensics already. I hope this is able to help anyone who’s just starting out or wants to know more about how to detect a phishing campaign, or someone accidentally downloading something they shouldn’t have.
I’m always happy to help, so please reach out if you need further explaining. I’m open to suggestions too if you’d like to hear more about a certain topic in this field. Over and out.




![[Blue Team Labs Online Write-up] Nonyx](https://miro.medium.com/v2/resize:fit:679/0*aYYHSGAcieHtzlhT.png)


